|
|
A
Graphical Analysis of |
|
|
|
|
Consider the graph, below, and the impact reduced taxes will have on the
amount of gas available and the price of gas. First, a quick
overview of the graph itself. The vertical axis measure the price
per gallon, while the horizontal axis measures the amount bought and sold
in the market (whether it be Flagstaff, or Arizona, or the entire
U.S.). No quantity values are given, because we don't deal with them
on a day-to-day basis. But, prices are shown, since we can relate to
them. The current market price is $3 per gallon.
The graph shows supply and demand. The supply curve(s) slope upward, to the right, indicating that a rise in price will, in and of itself, induce an increase in the amount of gasoline made available in the market. How does this happen? In a variety of ways - sellers redirect gasoline to particular markets (making more available), refiners push their facilities to refine more gasoline (shifting from heating oil to gas, or by working extra shifts, during the night and on weekends), producers work existing wells harder in order to get more oil per day. The curve is steeper the less responsive sellers and producers are, and it is flatter the more responsive are sellers and producers. The primary factor in determining how steep, or flat, the supply curve is depends on time - the shorter the time frame analyzed, the steeper the curve; the longer the time frame considered, the flatter the curve. The demand is downward sloping, showing that, at lower prices we would like to buy more gas, and at higher prices we would like to buy less gas. As with supply, this curve is steeper the shorter is the time frame analyzed, and flatter the longer is the time frame considered. |
|
|
|
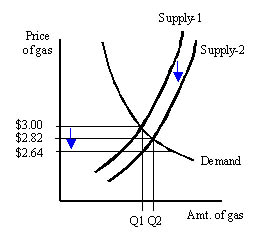
Initially, the market is represented by Supply-1 and Demand, with a price
of $3/gallon and a quantity purchased of Q1.
The gasoline taxes, state and federal, total to about 36 cents per gallon. So, repealing these taxes would reduce the seller's cost by 36 cents per gallon. This is shown by shifting the supply curve down by 36 cents, to Supply-2. So, why won't the price fall by 36 cents (to $2.64)? Because the consumers are responsive to price changes; i.e., demand is downward sloping. [If consumers were not responsive, the demand would be perfectly vertical, which is nonsensical - if that was true, it would be an ideal circumstance under which to raise taxes!]. |
|
Note, there was no shortage when the price is $3 - the amount supplied is
equal to the amount demanded. If the price goes down, consumers will
want more. If there is no more gas available, then there will now be
a shortage at this lower price and prices will have to rise back to $3
(i.e., the supply is vertical).
Note, there is a shortage if the price falls to $2.64. Here, the producer is earning the same as before (i.e., their "after-tax" earnings are unchanged), so there is no inducement to bring more gas to market. But, the consumer wants more gas, since the price to them has fallen. The horizontal distance, between the Demand and Supply-2, at the price of $2.64 represents this shortage. As long as producers can respond, the market price will land somewhere between $2.64 and $3.00. Exactly where depends on the relative responsiveness of producers and consumers, but lets just split the difference and say that the new market equilibrium price is $2.82 per gallon. At this price, producers will bring more gas to market, Q2-Q1.
So, at the end of all this, we get the following: |
|